WHAT IS THE CALIFORNIA SCHOOL DASHBOARD?

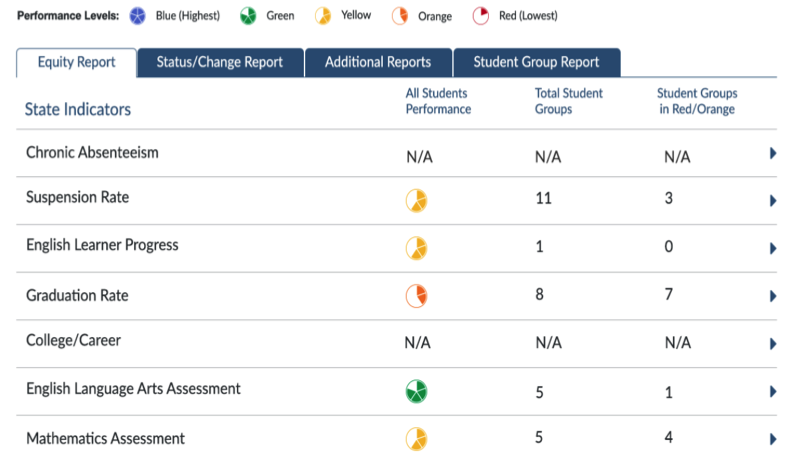
The California School Dashboard is a new website that parents/guardians, educators and the public can use to see how districts and schools are meeting the needs of California’s diverse student population based on multiple measures included in the new accountability system. The Dashboard will allow users to search by district or school and includes a set of easy-to-use reports showing district or school performance on 6 state indicators and 4 local indicators (6 for county offices of education) in different levels of detail. Key features included in the initial phase of the Dashboard are highlighted below.
Local educational agencies will be able to review their performance data during a private preview in February. The Dashboard’s design will continue to be refined based on user testing with a diverse range of stakeholders that will occur during the February preview period and beyond the March public launch.
Message from Our Superintendent, Cheryl Jordan:
The release of the
California School Dashboard aligns with a value I have held since 1989, when I began my career as a teacher in Milpitas Unified School District: a quality education is defined by MORE than a single test score.
The previous accountability system,
Academic Performance Index (API), was based on the results of annual standardized test scores, and nothing else. This number did not provide adequate information about strengths and growth needs because it was not a full-spectrum assessment portfolio.
California’s new state accountability tool is based on eight
Local Control Funding Formula Priority Areas. In addition to data about achievement in math and English language arts, we now have data on how English learners and their language development, student suspension rates, school attendance, and details on how each of our students groups are developing based on these multiple measures. High schools will be measured on graduation rates and how well they prepare students for college and careers. In the future, the new accountability system may replace the need for the ACT and SAT for college entrance in the CA university and state college systems.
Click here to read more

 Additional settings for Safari Browser.


